Understanding the present and past of your business

Share

Understanding the present and past of your business

(Descriptive Analysis)

Data analytics, as an emerging tool in industry 4.0, provides a general understanding of the business, allowing the development of sophisticated models to improve decision-making. Starting from basic processes such as data collection, storage and enrichment to achieving advanced objectives such as understanding the origin of an industrial problem where anticipating the occurrence of an error becomes a reality.

Analytics is divided into four levels: descriptive, diagnostic, predictive and prescriptive. In the first level of data analytics, which corresponds to descriptive analytics, the scope of data collection will be defined by understanding what are the challenges that companies are taking and what type of information they are storing to carry out these challenges.

What is descriptive analytics?

Descriptive analytics is a preliminary level of data processing where a summary of historical data is created in order to prepare this information for future analyzes that adequately contributes to the business.

In this stage, the data is stored to describe the current and past situation of the business through trends, patterns and exceptions related to exploratory analysis, with which the question “What has happened in the business?” is answered. This information is then processed to be displayed in graphics through reports, dashboards, among others.

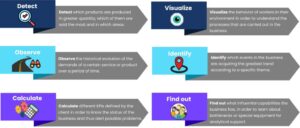
Descriptive analysis allows to:

How does descriptive analytics work?

Descriptive analytics focuses on working on a storage system where all relevant business data is concentrated. This system can be treated by means of files, relational, nonrelational and time-series databases, where the amount and complexity of the data to be handled will depend on the objectives to be met. On this storage system technologies that allow data processing are deployed, so that cleaning, structuring and enrichment processes can be carried out.

Subsequently, different visualization strategies are applied to summarize the status of the business and together with the client define a series of key metrics or KPIs (which are calculated on the data obtained) with which is possible to know when the indicators deviate from their expected values.

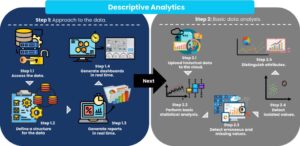
The following graphic summarizes the general steps that should be considered to execute this descriptive process:

Why use descriptive analytics?

Descriptive analytics focuses on the description and analysis of historical data in order to discover and/or diagnose trends and patterns of behavior that contribute to decision-making.

  • Some common uses of descriptive analysis in industrial sectors are:
  • Real-time data visualization.
  • Advanced data visualization using dashboards and reports.
  • Descriptive process statistics.
  • Detection of anomalies in production processes.
  • Identification of patterns for a productive process.